
Quick question: what is 6 plus 4? If you said 10, you are absolutely correct. Congratulations! While most people can add those numbers in their head, one always reliable method of solving that problem involves a calculator.
So can a calculator be used to predict someone’s sales for a particular year? We’re going to make the argument that it can. As long as you can provide some assumptions, we can tell you exactly what your sales will be. And not only can we tell you your won sales, but we’ll also tell you your lost sales as well as your total pushed deals.
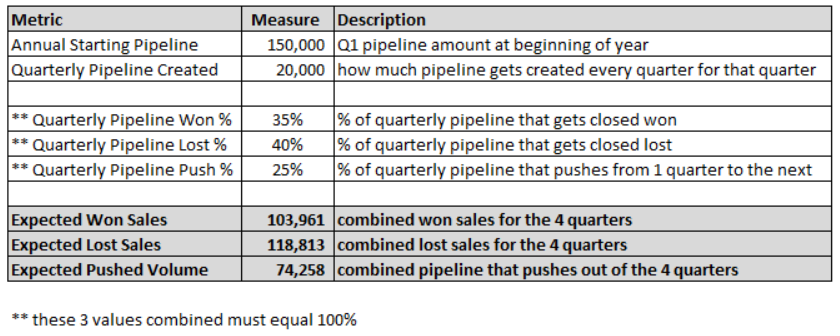
Note that the 5 white Measure cells are the inputs for this calculator. Suppose a sales rep named Johnny Crushit started a year with $150k in his pipeline, all of which was projected to close in the first quarter. Let’s also assume that Johnny adds $20k to his pipeline each quarter. In terms of his conversion percentages, Johnny wins 35% of his pipeline, loses 40%, and pushes 25% to the following quarter. The 3 gray Measure cells are the outputs. According to the parameters provided above and in the calculator photo, Johnny will close almost $104k this year while he will lose almost $119k.
 While the obvious reality is that predicting sales is never this easy, or even close to this easy, this calculator can provide sales management with some insights into their business. By adjusting the values in the input cells, management can view multiple scenarios and gain an understanding of the impact of various changes to the model. And if a manager needs to hit certain targets for the year, this model can provide some reality checks. When determining quotas, managers can use this model to come up with appropriate figures. Finally, an organization with an effective sales analytics campaign already implemented can leverage observed, actual conversion percentages in order to model various scenarios. This calculator can certainly be used in a variety of situations while providing valuable insights to a sales organization.
For example, if the starting pipeline amount were $160k while $15k in pipeline gets created per quarter, the $104k in sales actually decreases to $100k. Or suppose the won and lost rates each decrease by 10%. The won sales amount of $104k will decrease to $95k while the $119k in lost sales will only drop to $114k. What about if Johnny has a quota of $225k for the year? Using the starting pipeline and pipeline created amounts indicated in the picture, he will need to win 80% of his quarterly pipeline while pushing the remaining 20% in order to win $225k. If this 20% were lost instead of pushed, the won sales of $225k will drop to $184k.
Any sales organization needs to have an understanding of their conversion rates, of their pipeline creation expectations, of their sales cycles, and of their paths to attain expectations. The Sales Prediction Calculator allows for visibility into the key metrics while also emphasizing the importance of tracking these figures on an actual basis. For example, if the lost % is too high, management can launch a lost deal analysis exercise in which they’d seek to understand why the team is losing so many deals. Or if the push % is lower than anticipated, perhaps the expected selling cycle needs to be reduced.
While this calculator might not provide you with Inequality Graphing, Language Localizers, Periodic Table, Polynomial Root Finder/Simultaneous Equation Solver that fancy Texas Instrument calculators provide, we challenge you to find a Texas Instruments calculator that can predict your sales like our Sales Prediction Calculator.