Create an environment of discipline and accuracy.
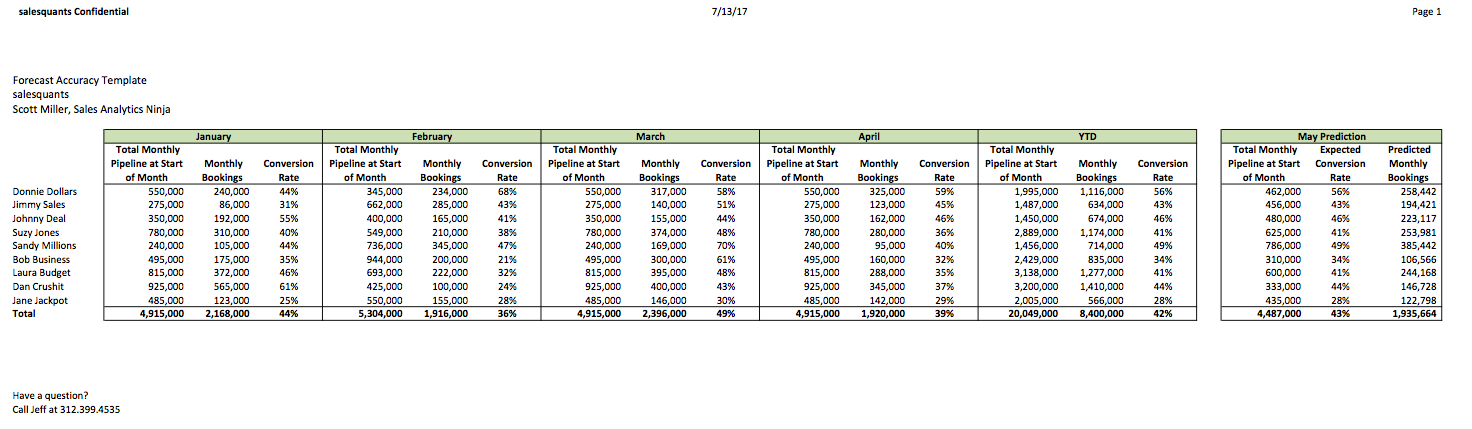
Below is an illustration of the Forecast Accuracy Template; our way to help sales leaders gain confidence through data to nail their forecast.
 (Click here to download the Forecast Accuracy Template)
You’ll see that the team closed $2.2M in Jan, $1.9M in Feb, $2.4M in Mar, and $1.9M in Apr. The monthly conversion rate % values simply represent a month’s bookings divided by the total pipeline amount at the beginning of the month. For example, you’ll see that Dan Crushit had $925k in his pipeline at the beginning of Jan that had project close dates within the month of Jan. Of this $925k, he closed $565k in Jan. His pipeline conversion rate was a super impressive 61%. On the other hand, Jane Jackpot only closed 25% of her Jan total pipeline in Jan.
The team as a whole has closed 42% of its pipeline in the respective forecasted months. The process works best when using a bottoms-up approach though. That being said, the prediction for May should add the predictions for each of the 9 sales reps. Donnie Dollars has the highest conversion rate (56%), and when multiplying his $462k May pipeline amount by his 56% YTD conversion rate, we can project him to close $258k in May. And when using this same approach for the 8 other reps, we can project a bookings amount of $1.9M in May based on a total pipeline amount of almost $4.5M.
To learn more about the Sales Analytics tips and tools that SalesQuants has to offer, click here!
Feel free to contact us with any questions or comments you may have using the form below.